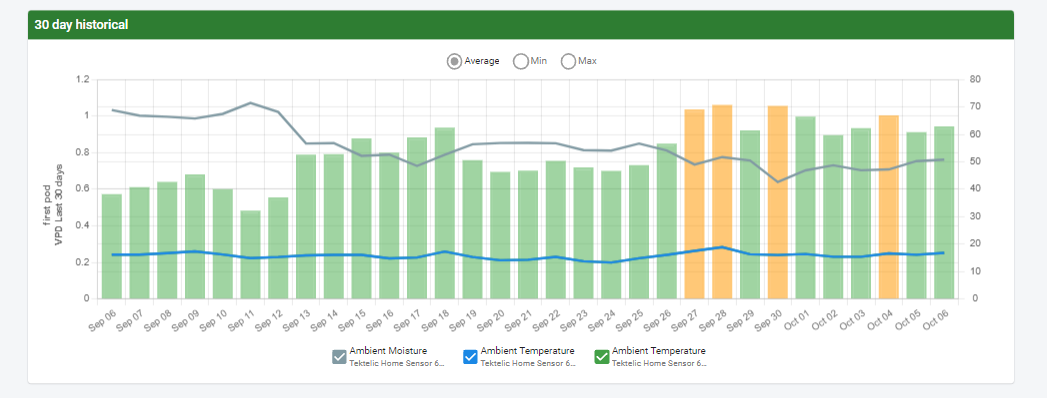
The historical screen can be used to view hour, daily, monthy or yearly data. The color coding will show if you an hour, month or day are within valid threshholds in the grow profile; green for within parameters, yellow for a warning or red to show out of range. Temperature and humidity lines can be displayed as well to understand where the particular reading is out of range.
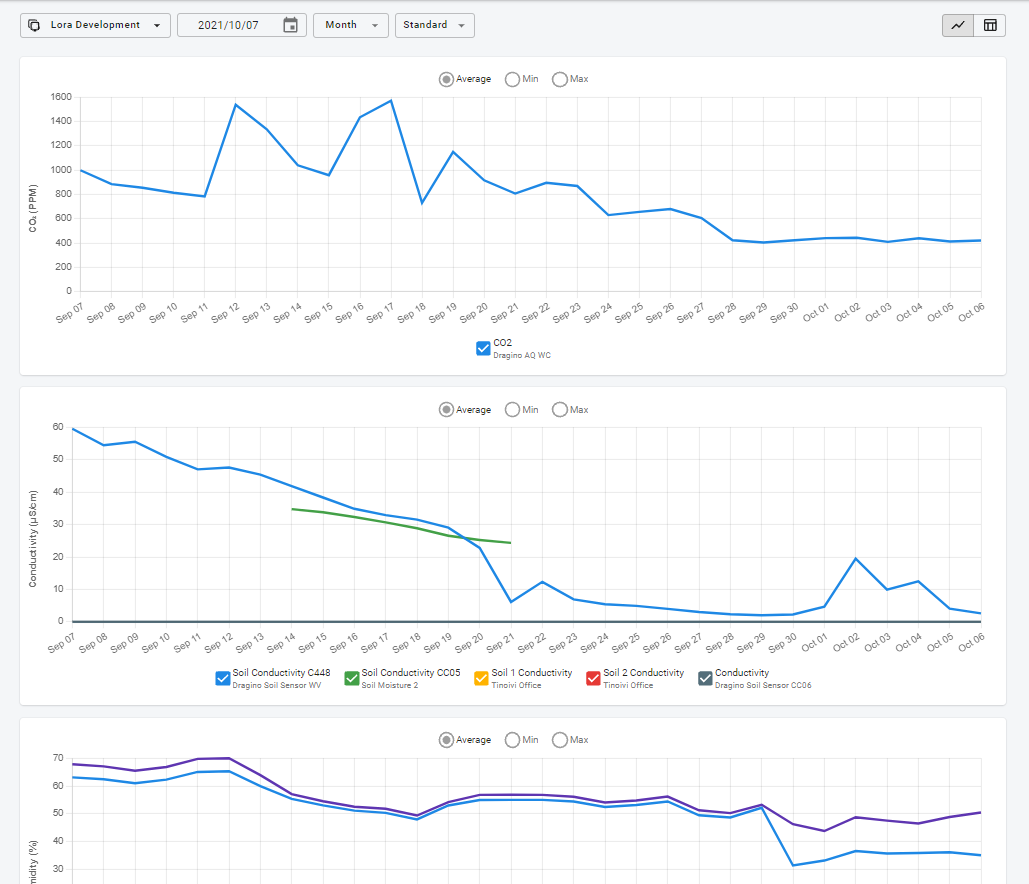
It is possible to view in chart or text view.